
Introduction
Retailers and e-commerce platforms collect large volumes of transaction data every day. Hidden inside these receipts and order histories are patterns about what customers tend to buy together. Market Basket Analysis (MBA) is a practical technique that helps uncover these relationships, enabling better product bundling, smarter recommendations, and more effective promotions. Whether you work in a supermarket, an online marketplace, or a subscription business, knowing which items “co-occur” can directly influence revenue and customer experience. This topic is also commonly introduced in a data analytics course because it turns raw transaction logs into clear, measurable insights that can be acted upon.
What Market Basket Analysis Actually Does
Market Basket Analysis is based on association rule mining. The goal is to identify rules of the form:
If a customer buys X, they are likely to buy Y.
For example:
- If customers buy bread, they may also buy butter.
- If customers buy mobile phones, they may also buy screen guards.
However, it is important to note that MBA does not prove causation. It identifies statistical associations that are useful for decisions like cross-selling and store layout planning. A strong association tells you that items occur together more often than you would expect by chance, which can be valuable even if the underlying reason is not fully known.
For professionals building analytical capability through a data analyst course in Pune, market basket analysis is a strong example of turning business questions into measurable metrics and interpretable rules.
Key Metrics: Support, Confidence, and Lift
Association rules can quickly become overwhelming if you generate too many item combinations. That is why three metrics—support, confidence, and lift—are used to filter and rank rules.
1) Support: How Common Is the Combination?
Support measures how frequently an itemset appears in the dataset.
- Support(X) = transactions containing X / total transactions
- Support(X ∩ Y) = transactions containing both X and Y / total transactions
If “milk and cereal” appear together in 200 out of 10,000 transactions, the support of {milk, cereal} is 0.02 (2%). Support helps ensure you focus on rules that occur often enough to matter. A rule with extremely low support might be statistically noisy or irrelevant for business decisions.
2) Confidence: How Often Does Y Appear When X Appears?
Confidence measures the conditional probability of buying Y given that X is bought.
- Confidence(X → Y) = Support(X ∩ Y) / Support(X)
If 500 customers bought cereal, and 200 of them also bought milk, then confidence(cereal → milk) = 200/500 = 0.4 (40%). Confidence helps identify rules that are reliable for prediction-like use cases, such as “customers who buy X often also buy Y.”
3) Lift: Is the Association Actually Meaningful?
Lift evaluates the observed co-occurrence of X and Y to what you would expect if they were independent.
- Lift(X → Y) = Confidence(X → Y) / Support(Y)
Lift is critical because confidence alone can be misleading. If Y is very common (like “water” in many grocery datasets), confidence may be high simply because many customers buy Y anyway. Lift corrects for this.
- Lift > 1: positive association (X increases the likelihood of Y)
- Lift = 1: no association (independent)
- Lift < 1: negative association (X reduces likelihood of Y)
In practice, lift often gives the clearest signal of whether a rule is genuinely useful for cross-selling or bundling.
How Market Basket Analysis Is Built in Practice
Most market basket workflows follow a repeatable structure.
Step 1: Prepare Transaction Data
You typically start with a dataset where each row is a transaction (order/receipt) and each transaction contains a list of items. This may require cleaning:
- standardising product names or SKUs
- handling returns or cancellations
- merging duplicate line items
- filtering extremely rare items that create noise
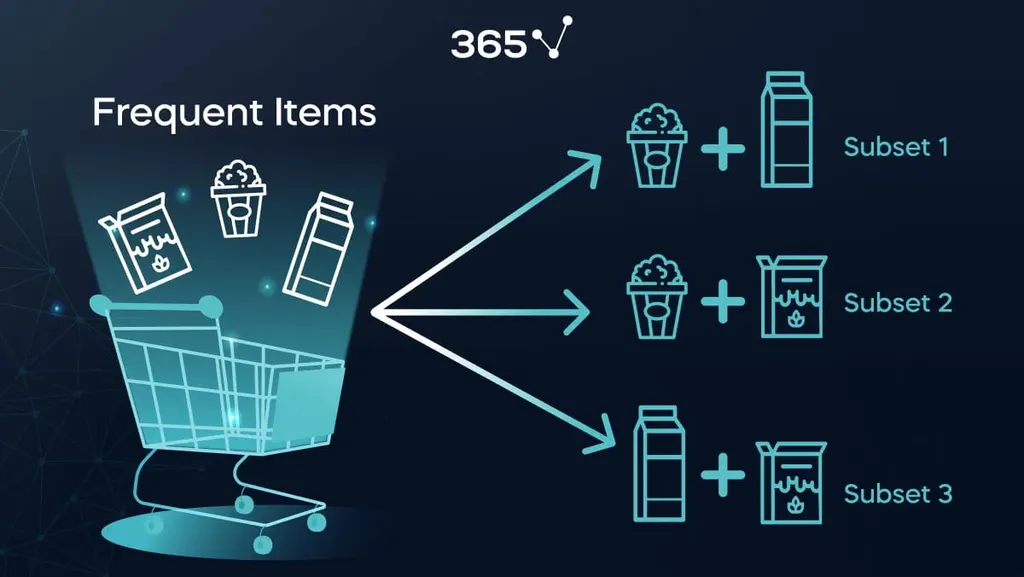
Step 2: Find Frequent Itemsets
Algorithms like Apriori or FP-Growth are used to discover frequent itemsets based on minimum support thresholds. FP-Growth is often faster on large datasets because it avoids generating too many candidate itemsets.
Step 3: Generate Rules and Filter Them
Once itemsets are found, rules are generated and filtered using confidence and lift thresholds. A typical approach is:
- minimum support to ensure business relevance
- minimum confidence to ensure reliability
- minimum lift to ensure meaningful association
This is exactly the kind of structured, metrics-first workflow you would learn in a data analytics course because it demonstrates how to balance statistical validity with business usefulness.
Real-World Use Cases and Business Actions
Market basket insights become valuable when they are translated into specific decisions.
- Product bundling: Pair items that show strong lift to create bundle offers (e.g., “pasta + pasta sauce”).
- Recommendation engines: Use high-confidence rules for “frequently bought together” suggestions.
- Store layout: Place complementary items closer to reduce friction, or separate them to increase exposure to other products, depending on strategy.
- Targeted promotions: Offer discounts on Y to customers who recently bought X, especially when lift is strong.
- Inventory planning: If demand for X increases, expect related demand changes for Y.
If you are learning applied analytics through a data analyst course in Pune, this is also a good example of how analysis connects directly to marketing, merchandising, and operations.
Conclusion
Market Basket Analysis is a practical method for uncovering product associations in transaction data. Support tells you whether a pattern is common, confidence tells you how reliably Y follows X, and lift tells you whether the relationship is truly meaningful beyond chance. When applied carefully—with clean data, sensible thresholds, and business context—association rules can guide bundling, recommendations, promotions, and inventory decisions. With these fundamentals in place, market basket analysis becomes a dependable tool for turning everyday sales data into clear, actionable insights.
Contact Us:
Business Name: Elevate Data Analytics
Address: Office no 403, 4th floor, B-block, East Court Phoenix Market City, opposite GIGA SPACE IT PARK, Clover Park, Viman Nagar, Pune, Maharashtra 411014
Phone No.:095131 73277