
Introduction: The Symphony of Patterns Over Time
Imagine standing before a symphony orchestra — every instrument playing a note, every musician following a rhythm. Some moments rise in perfect harmony, others diverge slightly, but together, they create a melody that only makes sense when viewed as a whole. In the world of data, Generalized Estimating Equations (GEE) play the role of a conductor — orchestrating scattered, correlated data into a coherent performance that reveals the collective story rather than focusing on a single player.
Traditional statistical methods often stumble when dealing with repeated measures or correlated data — such as tracking patients’ health over months or monitoring sales across stores over seasons. That’s where GEE shines. It doesn’t merely chase individual fluctuations but captures the population-averaged effect — the big picture across time and groups. For any aspiring analyst in a data scientist course, understanding GEE is like mastering the rhythm behind a complex composition — one that transforms noisy repetitions into meaningful insight.
Beyond the Snapshot: Why Ordinary Models Fall Short
Picture trying to understand a movie from a single still frame. Ordinary regression models do something similar — they analyze data as if every observation were independent. But real-world data rarely behaves that way. Measurements from the same person, sensor, or location tend to “talk” to each other — forming patterns over time.
GEE steps in by acknowledging this conversation. Instead of pretending every data point stands alone, it models the inherent correlation directly. It focuses on how groups behave collectively rather than how one subject behaves individually. For example, in a long-term clinical study tracking blood pressure responses to a new drug, GEE helps researchers see the average trend across all patients — regardless of individual quirks or random deviations.
When covered in a data science course in Pune, students often discover that GEE’s beauty lies in its robustness. It makes minimal assumptions about how data is distributed or correlated. Like an adaptive musician who can play with any band, GEE flexibly accommodates different “working correlation structures” — whether the data’s relationship weakens over time, stays consistent, or changes unpredictably.
The Architecture of GEE: Building Stability Amid Complexity
At its core, GEE refines the principles of generalized linear models (GLM) — but instead of focusing on isolated outcomes, it extends the framework to repeated or clustered data. It’s like reinforcing a bridge to handle recurring traffic rather than a single vehicle crossing once.
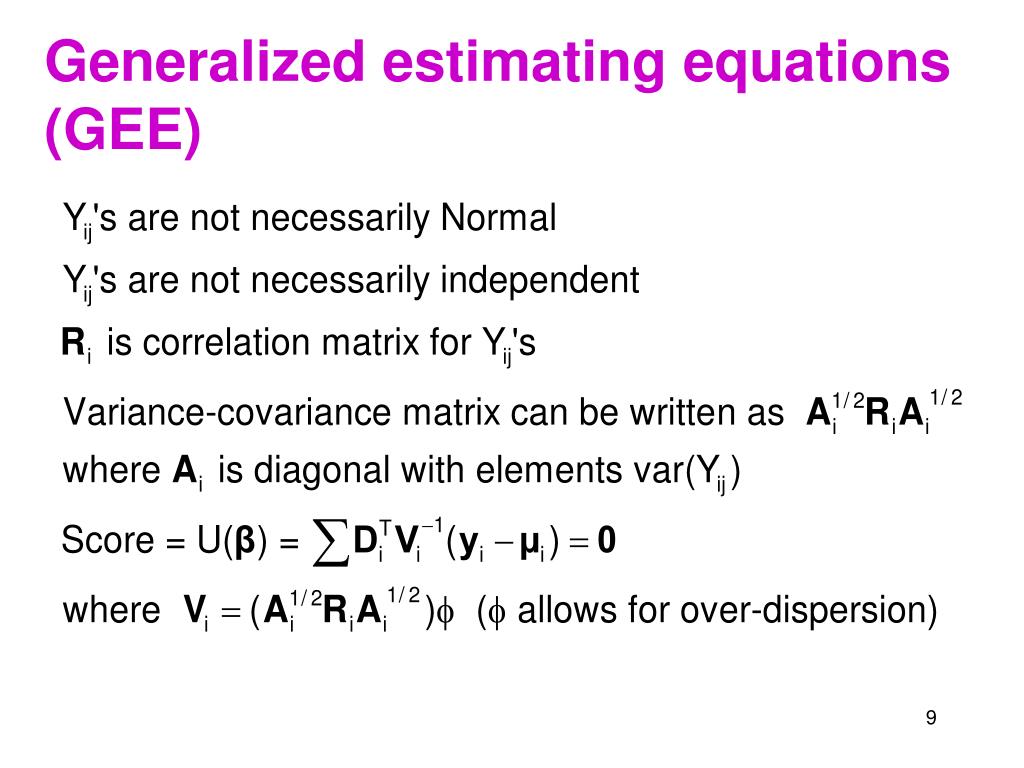
The genius of GEE lies in its iterative process. It estimates parameters using “quasi-likelihood,” continuously adjusting them until the population-level pattern stabilizes. The model incorporates a “working correlation matrix” — a structure that captures how observations relate within clusters. Even if the assumed structure isn’t perfect, GEE remains remarkably stable, ensuring that estimates remain consistent and unbiased.
This resilience is what makes GEE invaluable in fields as varied as healthcare, marketing analytics, and climate modeling. A data scientist who grasps this technique can uncover long-term behavioral patterns hidden beneath day-to-day fluctuations — precisely the kind of insight demanded in advanced analytics roles after completing a data scientist course.
Population-Averaged Effects: The Art of Seeing the Forest, Not the Trees
While mixed models dive into subject-specific effects — tracing the journey of each individual — GEE zooms out to observe the collective forest. This population-averaged lens is vital in public policy, epidemiology, and behavioral research, where decisions are made for communities, not individuals.
Consider a public health initiative studying the impact of a new dietary guideline across cities. Individual eating habits may vary wildly, but policymakers care about the overall shift in population health. GEE provides this macro-level clarity, showing how the average city resident’s health evolves over time, regardless of personal differences.
In this way, GEE is less a magnifying glass and more a panoramic lens — offering the kind of big-picture understanding that fuels data-driven strategy. Professionals undergoing a data science course in Pune often find this perspective transformative: it shifts their focus from isolated patterns to systemic understanding — a hallmark of advanced analytics maturity.
Why GEE Matters in the Era of Complex Data
Today’s data doesn’t sit neatly in tables — it streams from sensors, evolves with user behavior, and flows continuously through time. Whether it’s patient health metrics, customer retention data, or IoT device readings, the challenge is not just analysis, but correlation. GEE’s framework elegantly bridges that gap.
Its applications extend from predicting disease progression to optimizing marketing campaigns or understanding long-term environmental impacts. The methodology ensures that insights remain stable even when data points are connected — a critical feature in real-world analytics where independence is more myth than reality.
Moreover, as artificial intelligence and machine learning continue to evolve, GEE stands as a foundational tool — one that teaches data scientists to respect the structure of data before applying complex algorithms. It encourages a disciplined way of thinking about correlation, time, and dependency — a perspective often emphasized in a rigorous data scientist course curriculum.
Conclusion: From Echoes to Understanding
Generalized Estimating Equations remind us that patterns in data, like rhythms in music, are rarely random. They echo, repeat, and resonate — forming waves that reveal deeper truths when analyzed together. GEE allows analysts to translate these echoes into understanding, ensuring that time-linked or clustered data contributes to insight rather than confusion.
In a world overflowing with longitudinal data — from wearable health trackers to customer engagement analytics — mastering GEE is not just a technical advantage, but a philosophical one. It teaches us to see beyond moments, to find meaning in movement, and to transform noise into narrative.
For anyone charting their analytical journey through a data science course in Pune or exploring advanced topics in a data scientist course, GEE offers a profound lesson: that the real power of data lies not in isolated snapshots, but in the evolving story they collectively tell.
Business Name: ExcelR – Data Science, Data Analyst Course Training
Address: 1st Floor, East Court Phoenix Market City, F-02, Clover Park, Viman Nagar, Pune, Maharashtra 411014
Phone Number: 096997 53213
Email Id: enquiry@excelr.com